Generating IDs in C#, ‘safely’ and efficiently
Recently I needed to find an efficient algorithm for generating unique IDs in a highly concurrent and low latency component. After looking at several options I settled for the algorithm used by the Kestrel HTTP server. Kestrel generates request IDs that are stored in the TraceIdentifier property hanging off the HTTPContext.
The IDs are base-32 encoded increments of a long (which is seeded based on the DateTime.UtcNow.Ticks) using the characters 1 to 9 and A to V.
Let’s look at the code:
internal static class CorrelationIdGenerator
{
    private static readonly string _encode32Chars = "0123456789ABCDEFGHIJKLMNOPQRSTUV";

    private static long _lastId = DateTime.UtcNow.Ticks;

    public static string GetNextId() => GenerateId(Interlocked.Increment(ref _lastId));

    private static unsafe string GenerateId(long id)
    {
        char* charBuffer = stackalloc char[13];

        charBuffer[0] = _encode32Chars[(int)(id >> 60) & 31];
        charBuffer[1] = _encode32Chars[(int)(id >> 55) & 31];
        charBuffer[2] = _encode32Chars[(int)(id >> 50) & 31];
        charBuffer[3] = _encode32Chars[(int)(id >> 45) & 31];
        charBuffer[4] = _encode32Chars[(int)(id >> 40) & 31];
        charBuffer[5] = _encode32Chars[(int)(id >> 35) & 31];
        charBuffer[6] = _encode32Chars[(int)(id >> 30) & 31];
        charBuffer[7] = _encode32Chars[(int)(id >> 25) & 31];
        charBuffer[8] = _encode32Chars[(int)(id >> 20) & 31];
        charBuffer[9] = _encode32Chars[(int)(id >> 15) & 31];
        charBuffer[10] = _encode32Chars[(int)(id >> 10) & 31];
        charBuffer[11] = _encode32Chars[(int)(id >> 5) & 31];
        charBuffer[12] = _encode32Chars[(int)id & 31];

        return new string(charBuffer, 0, 13);
    }
}
If we invoke it like so:
CorrelationIdGenerator.GetNextId();
Thread.Sleep(50);
CorrelationIdGenerator.GetNextId();
Thread.Sleep(150);
CorrelationIdGenerator.GetNextId();
We get:
0HLH7QN5JTC87
0HLH7QN5JTC88
0HLH7QN5JTC89
Overall, this code is very efficient in how it constructs a string representation of an ID based on a long by avoiding the .ToString() call which (according to the comments on the code) would be ~310% and ~600% slower on x64 and x86 respectively.
It also avoids allocating memory on the heap avoiding frequent GC collections (when invoked on a hot path) by allocating a char[] on the stack, populating it with the encoded values then passing the char pointer to the string constructor.
Impressive stuff, but…
Allocating memory on the stack (using stackalloc) has long been used as a performance trick; Not only it can be faster than heap allocation but it also avoids GC. However, there are some caveats:
-
stackallocis explicitly unsafe (hence why I used'safe'in the title of this article) which means you would have to compile your assembly as such (by using theunsafeflag). Doing so means that your assembly may be black-listed by some environments where loading ofunsafeassemblies are not permitted. e.g. SQLServer (although there are workarounds). (Also note that as of C#7.2unsafeis no longer required as long as you useSpanwhen usingstackalloc) -
The amount of data you are allowed to allocate is very limited. Managed stacks are limited to 1MB in size and can be even less when running under IIS. Each stack frame takes a chunk of that space so the deeper the stack the less memory will be available.
-
If an exception is thrown during allocation, you will get an
StackOverflowExceptionwhich is best known as an exception that cannot be caught. To be fair, Kestrel allocates a small block of memory when generating an ID, therefore, the chances of overflowing is rare; However, I still prefer to be on the safe side if and when I can.
With the above points in mind, I got curious to see if I can avoid using unsafe and:
- Measure the performance impact of going without it.
- Try close the gap in the performance as much as possible and bring it to a reasonable level.
A bit about how we are going to measure the performance
If you have not yet read my previous articles I suggest having a look so that you can get familiar with some of the terms, tools and my overall approach to profiling.
- Practical Parallelization in C#
- High Performance Logging using log4net
- Counting Lines of a Text File in C#, the Smart Way
- Stuff Every .NET App Should be Logging at Startup
We are going to start by doing some coarse-grained/high-level measurements just so that we get a general idea of the behaviour of GC and the running time for our baseline algorithm before we start playing with things.
We will be running a .NET Core 2.1.5 application hosted on Windows Server 2016. Our machine is a dual CPU Xeon processor with 12 cores (24 logical) clocking at 2.67GHz.
Also note the GC mode of our application will be set to Workstation to emphasise the impact of the GC collections on the process (refer to the links above for finding out the difference between Workstation and Server). The overall result of our benchmark should still be valid with Server mode enabled.
Let’s start by generating 100 million IDs while measuring the execution time and the GC behaviour. We will repeat this 10 times and look at the average values across all executions.
Here is the code for generating the IDs:
Stopwatch sw = Stopwatch.StartNew();
for(int i = 0; i < 100_000_000; i++)
{
    string id = CorrelationIdGenerator.GetNextId();
}
sw.Stop();

using Process process = Process.GetCurrentProcess();

Console.WriteLine("Execution time: {0}\r\n  - Gen-0: {1}, Gen-1: {2}, Gen-2: {3}",
        sw.Elapsed.ToString(),
        GC.CollectionCount(0),
        GC.CollectionCount(1),
        GC.CollectionCount(2));
This not-so-fancy code starts a timer, generates a lot of IDs then measures how many times GC collections occurred across the 3 generations.
1. Stackalloc
With all the above out of the way, here’s the average values for our baseline:
- Execution time: 00:00:06.0511525
- Gen-0: 890, Gen-1: 0, Gen-2: 0
Okay, so it took around 6 seconds and 890 Gen0 GC to generate the IDs. If you are wondering why we have those Gen0 collections despite allocating on the stack, well, the answer is; We are only allocating the char[] on the stack but we still need to allocate 100 million string objects on the heap.
Now that we know how our baseline behaves, let us measure how we would have done if we had allocated the char[] on the heap instead of the stack.
2. Heap allocation
All we have to do for this version is remove the unsafe keyword and new up a char[], with everything else unchanged.
private static string GenerateId(long id)
{
    var buffer = new char[13];

    buffer[0] = _encode32Chars[(int)(id >> 60) & 31];
    buffer[1] = _encode32Chars[(int)(id >> 55) & 31];
    buffer[2] = _encode32Chars[(int)(id >> 50) & 31];
    buffer[3] = _encode32Chars[(int)(id >> 45) & 31];
    buffer[4] = _encode32Chars[(int)(id >> 40) & 31];
    buffer[5] = _encode32Chars[(int)(id >> 35) & 31];
    buffer[6] = _encode32Chars[(int)(id >> 30) & 31];
    buffer[7] = _encode32Chars[(int)(id >> 25) & 31];
    buffer[8] = _encode32Chars[(int)(id >> 20) & 31];
    buffer[9] = _encode32Chars[(int)(id >> 15) & 31];
    buffer[10] = _encode32Chars[(int)(id >> 10) & 31];
    buffer[11] = _encode32Chars[(int)(id >> 5) & 31];
    buffer[12] = _encode32Chars[(int)id & 31];

    return new string(buffer, 0, 13);
}
Right, let us measure this version:
- Execution time: 00:00:06.1883507
- Gen-0: 1780, Gen-1: 0, Gen-2: 0
Allocating on the heap seems to be about 140 milliseconds slower than allocating on the stack; However, we have doubled the number of _GC_s. You may now be saying:
Dude, it doesn’t matter. Gen0 GCs are super fast…
And you would be right; Both Gen0 and Gen1 collections are fast but unlike the Gen2 collections, they are blocking; So, the more IDs you generate, the more frequent blocking collections wasting CPU cycles reducing your overall throughput. This may not be a problem for your application and if it is not then fair enough but there are scenarios where you need to reduce allocations as much as possible.
Okay, what is the most simple method of reducing those allocations? Reusing the char[] you say? Sure, let’s try that…
3. Re-using the buffer
What we need to do here is declare a field for our re-usable char[] buffer and overwrite it for every ID we generate.
private static readonly char[] _buffer = new char[13];

private static string GenerateId(long id)
{
    char[] buffer = _buffer;
    ...
}
And this is how it does:
- Execution time: 00:00:05.5621535
- Gen-0: 890, Gen-1: 0, Gen-2: 0

Excellent! Awesome gains! Super fast! No allocation! Let’s wrap up!
But wait a second
The unsafe version was thread-safe and our version is not. What if we want to generate the IDs from different threads and in parallel?
No worries, all we have to do is ensure access to the char[] is synchronised across all threads and for that we are going to use a simple lock, let’s go!
4. Locking the buffer
With the rest of the code unchanged, Let us lock the body of our method like so:
private static string GenerateId(long id)
{
    lock(_buffer)
    {
        char[] buffer = _buffer;
        ...
    }
}
And run the benchmark:
- Execution time: 00:00:07.7254997
- Gen-0: 890, Gen-1: 0, Gen-2: 0
Okay, no more allocation other than the actual string representation of our IDs. As you can see the cost of using the lock is an extra second or so of overhead.
But this is not a valid test
Even though we now have a thread-safe method, we have so far only generated the IDs from a single thread and that is not representative of how our code can and will be used out in the wild.
A more realistic scenario
We are going to sprinkle a bit of parallelism to our benchmarking code by generating 1 billion IDs across 12 threads in parallel.
Here is the updated code for our benchmarker:
const int ITERATION_COUNT = 1_000_000_000;
const int THREAD_COUNT = 12;

Stopwatch sw = Stopwatch.StartNew();

ParallelEnumerable
    .Range(1, ITERATION_COUNT)
    .WithDegreeOfParallelism(THREAD_COUNT)
    .WithExecutionMode(ParallelExecutionMode.ForceParallelism)
    .ForAll(_ => {
        string id = CorrelationIdGenerator.GetNextId();
    });

sw.Stop();

using Process process = Process.GetCurrentProcess();
Console.WriteLine("Execution time: {0}\r\n  - Gen-0: {1}, Gen-1: {2}, Gen-2: {3}",
        sw.Elapsed.ToString(),
        GC.CollectionCount(0),
        GC.CollectionCount(1),
        GC.CollectionCount(2));
5. Stackalloc (Parallel)
Now that we have updated our benchmarker, we need to run it again for our baseline to see how it does in parallel.
- Execution time: 00:00:58.9092805
- Gen-0: 8980, Gen-1: 5, Gen-2: 0
Okay, so 8,980 Gen0, 5 Gen1 and 00:00:58.9092805 is what we are up against.
6. New buffer (Parallel)
As a reminder, this is the version where we are creating a new char[] each time we are generating an ID. So let us see the performance of this allocaty method in parallel:
- Execution time: 00:01:04.6934614
- Gen-0: 17959, Gen-1: 19, Gen-2: 0
Again, we can see the high number of allocations except this time the Gen1 allocations are also increasing.
7. Locking the buffer (Parallel)
Not to worry, we have it all under control. We will be avoiding all those nasty allocations thanks to our friend Mr lock! Let’s go:
- Execution time: 00:04:14.3642255
- Gen-0: 9008, Gen-1: 25, Gen-2: 2

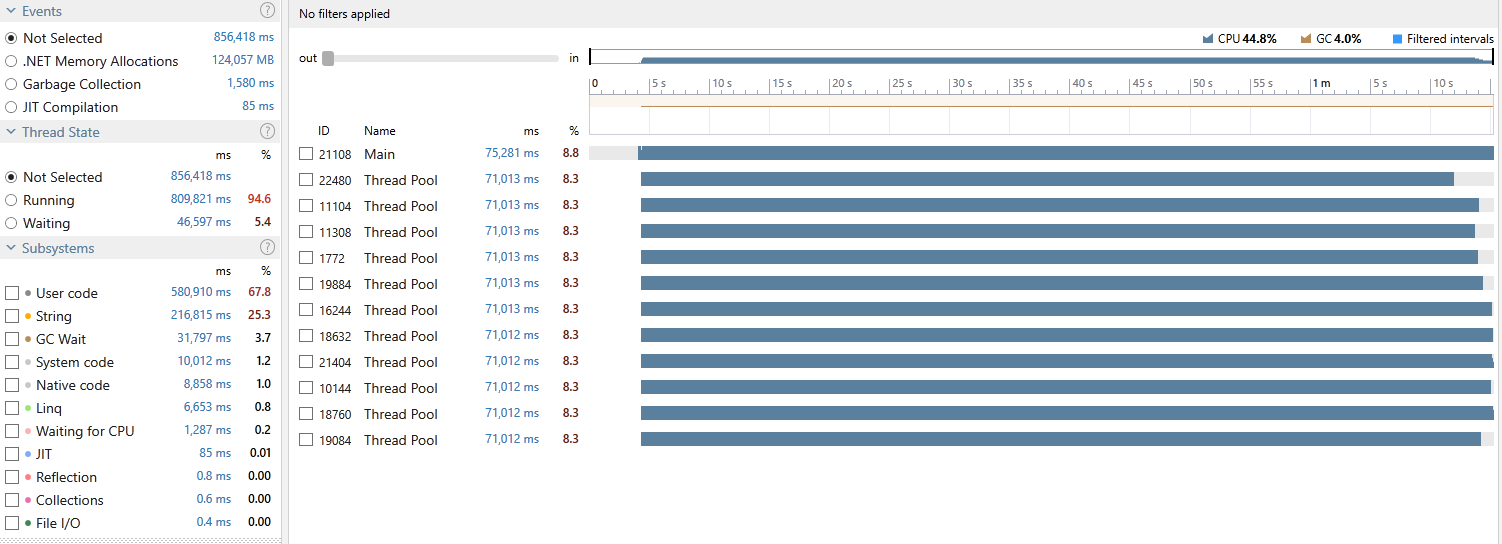
Yep, looks like Mr lock was not much of a friend after all! not only it took us 4 times longer but also 25 Gen1 and 2 Gen2 collections. But why? Isn’t acquiring a lock fast? Well, that depends; Acquiring a non-contended lock is extremely fast (~20 ns) but if contended, the context switch depending on the number of competing threads can quickly increase this to microseconds which in our case resulted in a noticeable performance hit.
Indeed, if we profile this app using dotTrace (refer to my previous blog posts for more details) we can see that we spent a whopping 75% of our total execution time waiting in Lock contention (click to enlarge):
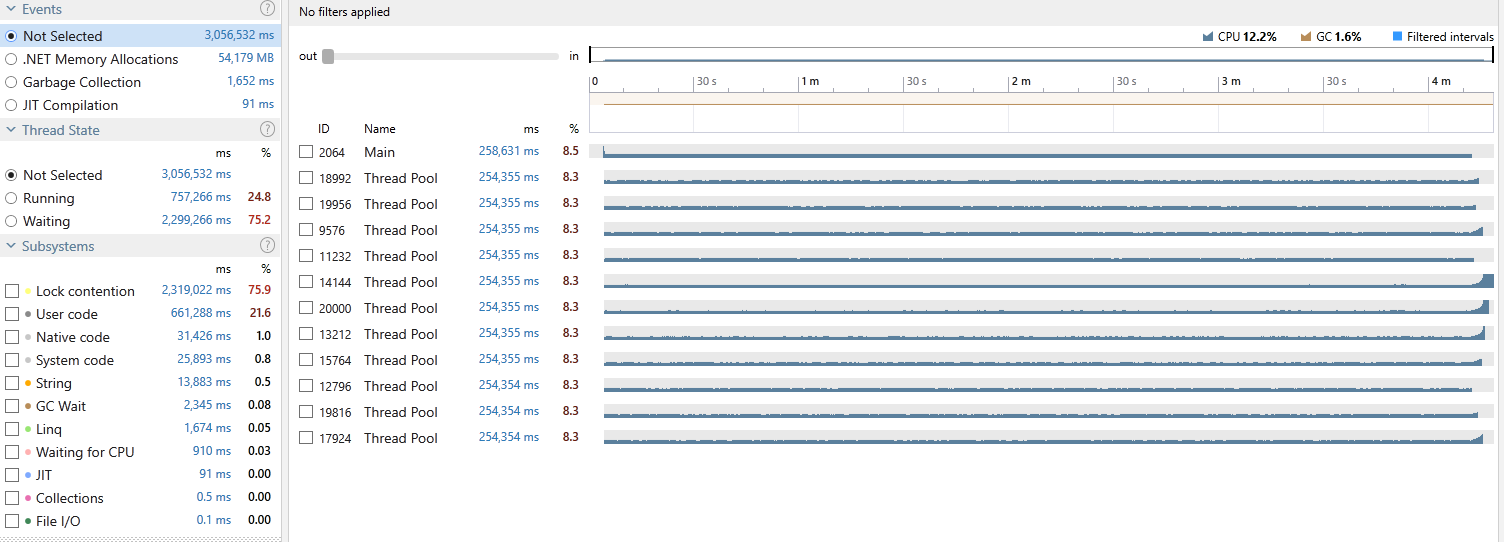
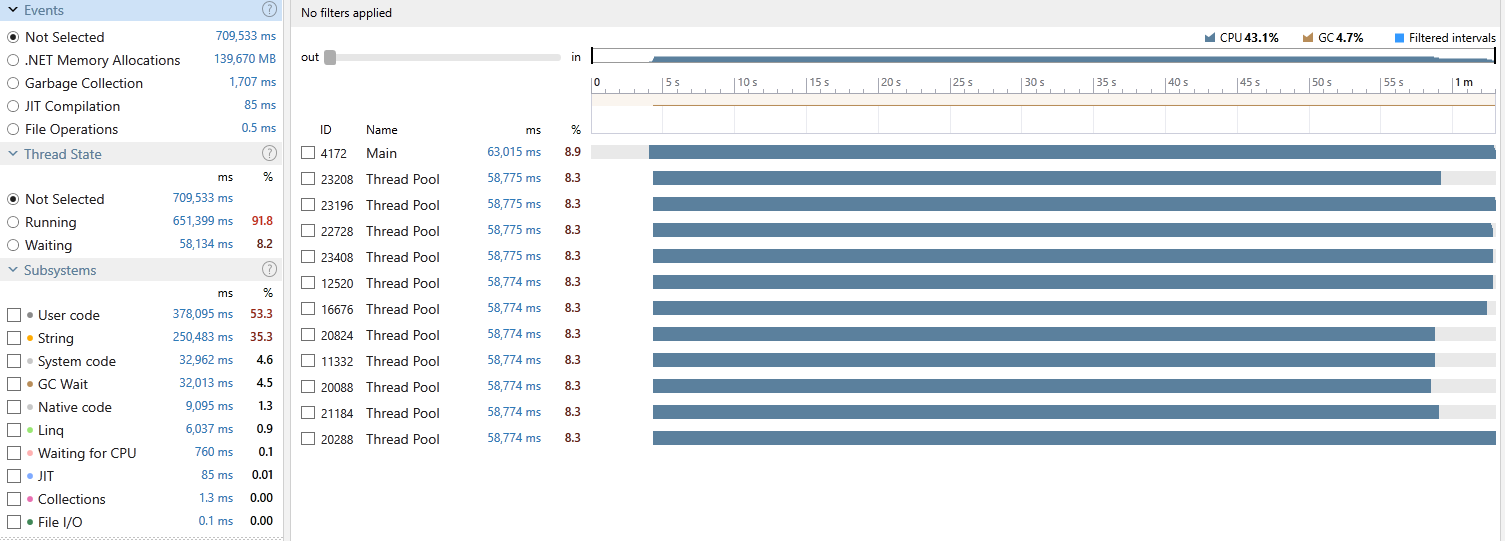
Those 12 threads are barely utilising the CPU. Let’s compare that with our stackalloc version:
See how nice and healthy those threads are? Those context switches are wasting the CPU cycles. If only we could somehow reduce it…
8. Spin Locking
Guess what? We can avoid those context switches by using a SpinLock.
SpinLock lets you lock without incurring the cost of a context switch, at the expense of keeping a thread spinning (uselessly busy) - Albahari
And this is how we are going to use it in our code:
private static readonly char[] _buffer = new char[13];
private static SpinLock _spinner = new SpinLock(false);

private static string GenerateId(long id)
{
    bool lockTaken = false;
    try
    {
        _spinner.Enter(ref lockTaken);

        char[] buffer = _buffer;
        ...
        return new string(buffer, 0, 13);
    } finally
    {
        if (lockTaken)
        {
            _spinner.Exit();
        }
    }
}
<warning>IMPORTANT</warning>
You should almost never use a SpinLock as it comes with many gotchas one of which is that unlike a lock (aka Monitor) a SpinLock is not re-entrant; So, if you cannot figure out why I have set its constructor parameter to false or why the _spinner field has not been declared as readonly, then it means you should not be using SpinLock until you fully understand how it works (I still do not!) and once you do, you should totally erase any memory of SpinLock from your head. Seriously, DO NOT USE IT! Nevertheless, you can have a look at THIS and THIS to satisfy your curiosity.
Let’s see what difference SpinLock makes:
- Execution time: 00:01:34.5641002
- Gen-0: 8962, Gen-1: 9, Gen-2: 0
It looks like this time we did much better by not having to do as many context switches as we did when we were locking; But let us have a closer look at what our process was actually doing:
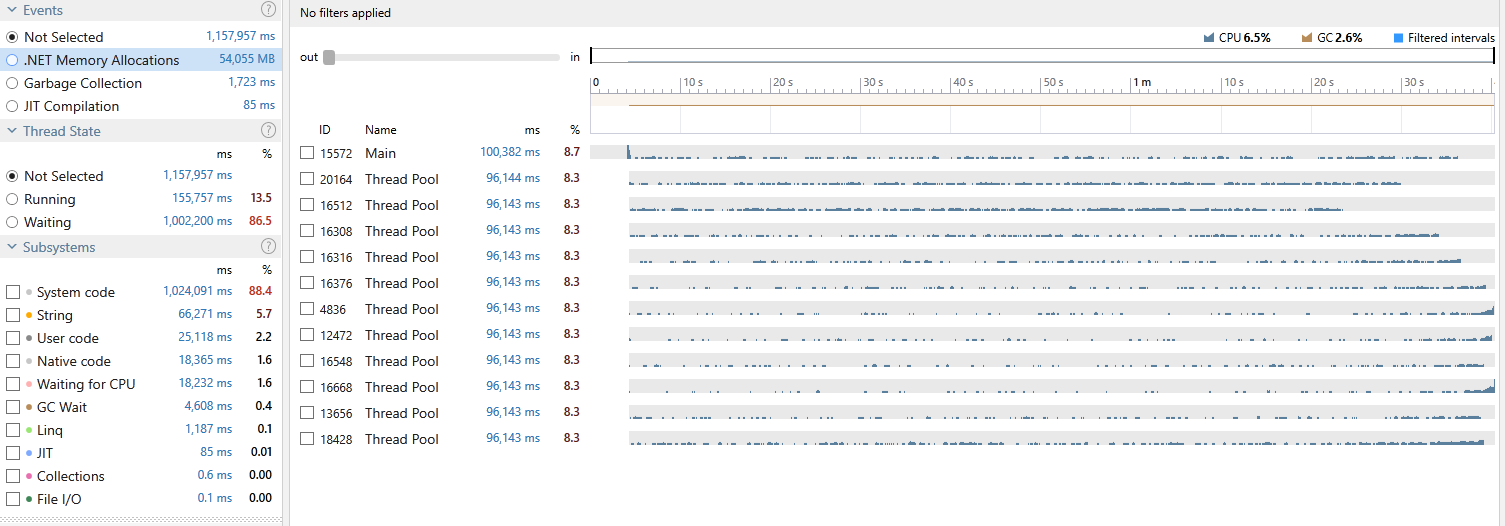
Even though we had no contentions, we spent only 13.5% of our total execution time running and the rest spinning and wasting precious CPU time. NOT GOOD!
The Evil Shared State
Sharing the char[] across our worker threads does not seem to be a good choice after all. How can we eliminate this shared resource and at the same time avoid allocating? If only there was a way for each thread to have its own buffer to work with…
Well, .NET has a facility which allows us to do just that.
9. ThreadStatic
Any static field marked with a ThreadStatic attribute is attached to a thread and each thread will then have its own copy of it. You can think of it as a container which holds a separate instance of our field for every thread.
A static field marked with
ThreadStaticAttributeis not shared between threads. Each executing thread has a separate instance of the field, and independently sets and gets values for that field. If the field is accessed on a different thread, it will contain a different value. MSDN
When using ThreadStatic, we are not required to specify an initial value for our field; if we do, then the initialisation occurs once the static constructor of the class is executed, therefore, the value is only set for the thread executing that constructor; When accessed in all subsequent threads, it will be initialised to its default value. So, in our case, before each thread tries to use the buffer for the first time, we need to make sure the field for that thread is initialised to a new char[] otherwise its value will be null.
This is what our code looks like with ThreadStatic:
[ThreadStatic]
private static char[] _buffer;

private static string GenerateId(long id)
{
    if (_buffer is null)
    {
        _buffer = new char[13];
    }

    char[] buffer = _buffer;
    ...
}
Let’s see how this one does:
- Execution time: 00:01:11.0138624
- Gen-0: 8981, Gen-1: 7, Gen-2: 0
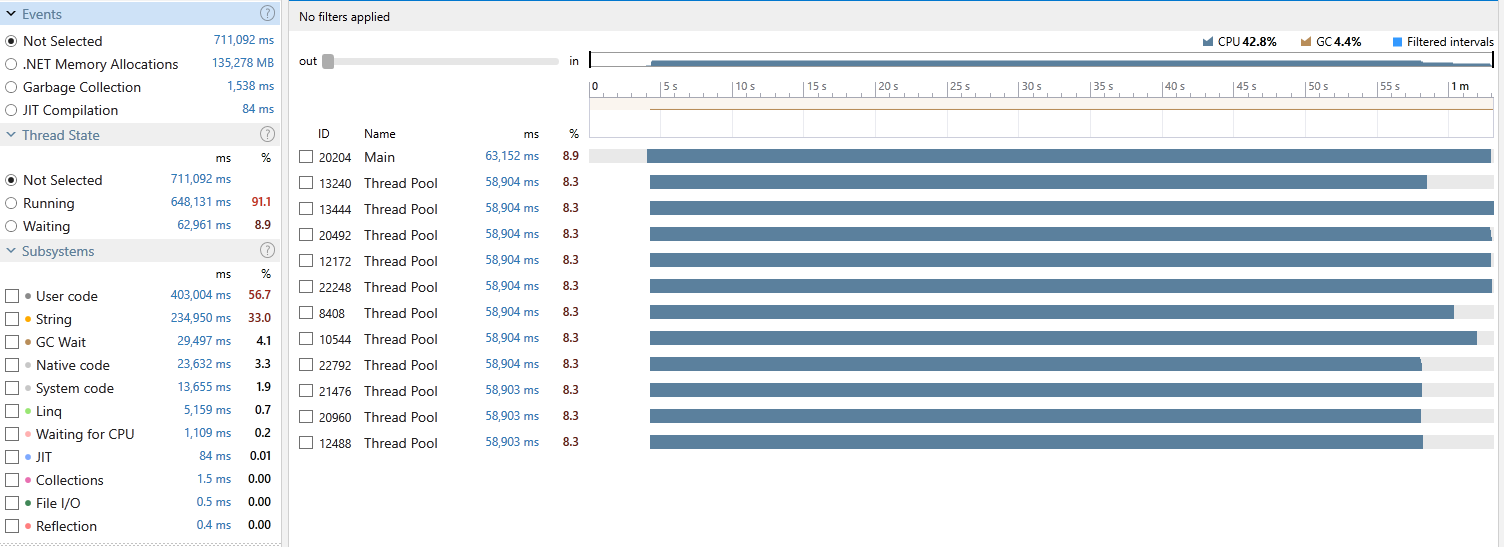
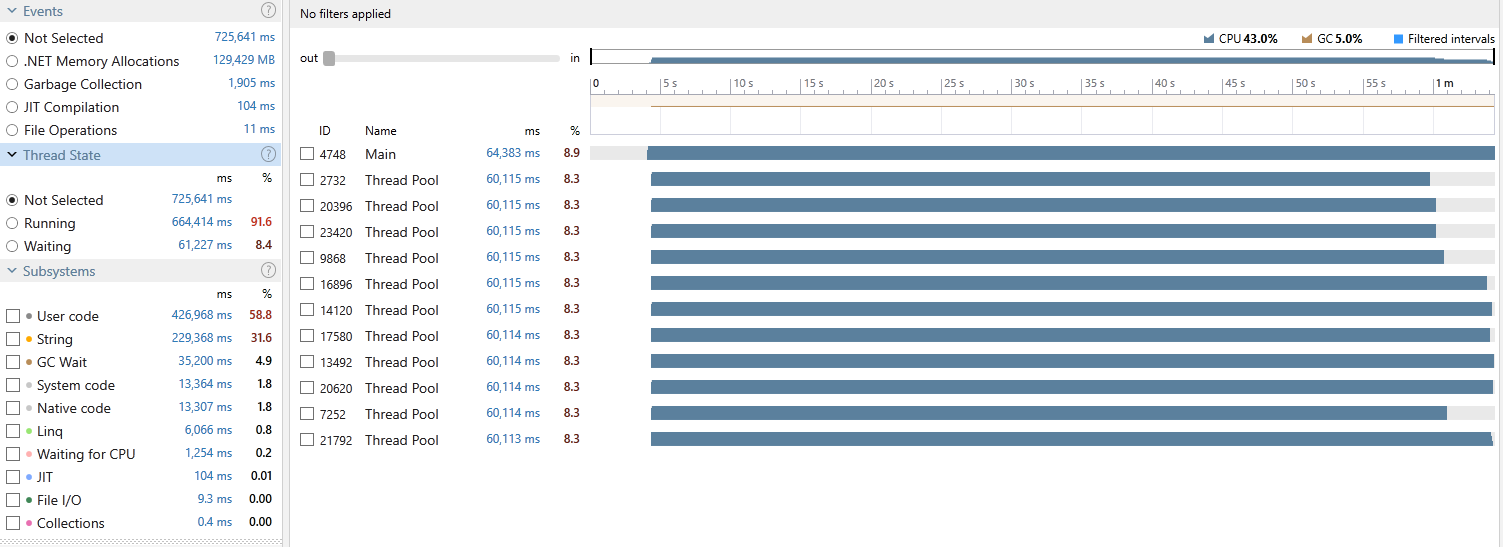
Okay, we are getting there! We reduced the execution time by around 20 seconds. Let us see how our threads performed:
Now we are talking! As you can see from the image, all our threads are showing a healthy utilisation and overall spent 94.6% of their time running. This is what we wanted as eliminating that shared buffer also removes any contention between our worker threads enabling them to each do their work independently with no bottleneck.
Okay good, but can we do better? Just a little bit faster?
10. ThreadLocal
Starting from .NET4.0, ThreadLocal provides Thread Local Storage (TLS) of data. It also improves on ThreadStatic by providing a strongly typed, locally scoped container to store values specific to each thread. Unlike ThreadStatic, you can mark both instance and static fields with it. It also allows you to use a factory method to create or initialise its value lazily and on the first access from each thread.
Side note
I have used this ThreadLocal trick many times in the past including in Easy.MessageHub (a high-performance Event Aggregator which you can read about HERE) to avoid locking and remove contention between threads.
Armed with our new friend, I present to you the final version of our code:
private static readonly ThreadLocal<char[]> _buffer =
    new ThreadLocal<char[]>(() => new char[13]);

private static string GenerateId(long id)
{
    char[] buffer = _buffer.Value;

    buffer[0] = Encode_32_Chars[(int)(id >> 60) & 31];
    buffer[1] = Encode_32_Chars[(int)(id >> 55) & 31];
    buffer[2] = Encode_32_Chars[(int)(id >> 50) & 31];
    buffer[3] = Encode_32_Chars[(int)(id >> 45) & 31];
    buffer[4] = Encode_32_Chars[(int)(id >> 40) & 31];
    buffer[5] = Encode_32_Chars[(int)(id >> 35) & 31];
    buffer[6] = Encode_32_Chars[(int)(id >> 30) & 31];
    buffer[7] = Encode_32_Chars[(int)(id >> 25) & 31];
    buffer[8] = Encode_32_Chars[(int)(id >> 20) & 31];
    buffer[9] = Encode_32_Chars[(int)(id >> 15) & 31];
    buffer[10] = Encode_32_Chars[(int)(id >> 10) & 31];
    buffer[11] = Encode_32_Chars[(int)(id >> 5) & 31];
    buffer[12] = Encode_32_Chars[(int)id & 31];

    return new string(buffer, 0, buffer.Length);
}
Let’s take it for a spin:
- Execution time: 00:00:58.7741476
- Gen-0: 8980, Gen-1: 5, Gen-2: 0
And just like that, we managed to beat the stackalloc version by 135ms!

Here’s the profiling snapshot where once again we can see a clean and healthy utilisation across all our threads.
Bonus point
Shortly after publishing this article, Ben Adams the author of the original pull request for Kestrel’s ID generation reminded me of the new String.Create method which allows us to avoid both stack and heap allocation for our buffer and write directly to the string memory.
You will need to be on .NET Core 2.1 or higher and know the length of your string in advance. The method then allocates a string and gives you a Span<char> allowing you to essentially write directly into the string’s memory on the heap.
This is how that version would look like:
public static string GenerateId(long id) =>
    string.Create(13, id, _writeToStringMemory);

private static readonly SpanAction<char, long> _writeToStringMemory =
    // DO NOT convert to method group otherwise will allocate
    (span, id) => WriteToStringMemory(span, id);

private static void WriteToStringMemory(Span<char> span, long id)
{
    span[0] = Encode_32_Chars[(int) (id >> 60) & 31];
    span[1] = Encode_32_Chars[(int) (id >> 55) & 31];
    span[2] = Encode_32_Chars[(int) (id >> 50) & 31];
    span[3] = Encode_32_Chars[(int) (id >> 45) & 31];
    span[4] = Encode_32_Chars[(int) (id >> 40) & 31];
    span[5] = Encode_32_Chars[(int) (id >> 35) & 31];
    span[6] = Encode_32_Chars[(int) (id >> 30) & 31];
    span[7] = Encode_32_Chars[(int) (id >> 25) & 31];
    span[8] = Encode_32_Chars[(int) (id >> 20) & 31];
    span[9] = Encode_32_Chars[(int) (id >> 15) & 31];
    span[10] = Encode_32_Chars[(int) (id >> 10) & 31];
    span[11] = Encode_32_Chars[(int) (id >> 5) & 31];
    span[12] = Encode_32_Chars[(int) id & 31];
}
Ready to see the result?
- Execution time: 00:01:00.1041126
- Gen-0: 8980, Gen-1: 6, Gen-2: 0
And here’s how the process was doing:
Hmm… this is not what I expected. Could it be that we are spending a little too much time Bounds Checking? Let’s give the JIT a little help by reversing the buffer population:
private static void WriteToStringMemory(Span<char> span, long id)
{
    span[12] = Encode_32_Chars[(int) id & 31];
    ...
    span[0] = Encode_32_Chars[(int) (id >> 60) & 31];
}
And how about now?
- Execution time: 00:00:56.6800000
- Gen-0: 8980, Gen-1: 5, Gen-2: 0
Excellent!
Conclusion
As we discussed before, our focus was to avoid using unsafe whilst trying to minimise any potential drop in the performance. The goal was not to be faster than the baseline but as it turned out we managed to shave a little bit off which is also nice.
I have included the final version of this method (IDGenerator) in Easy.Common. You can also find the benchmark code HERE.
I hope you enjoyed this article. Happy ThreadLocaling all the things!